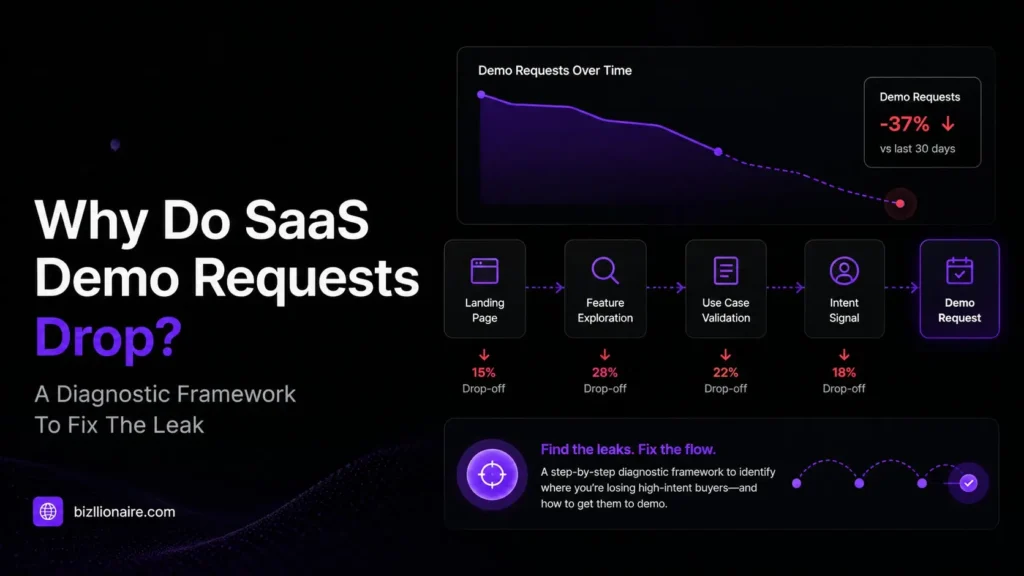
Your demo requests fell off a cliff. The traffic looks roughly the same, the product hasn’t changed, and yet the form fills that feed your whole sales pipeline are down 30% or more. If that’s the situation you’re in, this guide gives you a clear way to find the leak and close it, without guessing.
Quick Summary
- A 30% drop in demo requests is almost never one big problem. It’s usually two or three small ones stacking up at the same time.
- The fastest way to diagnose it is to work backwards through your funnel: traffic, then page, then form, then follow-up.
- Real benchmarks help you judge whether you have a conversion problem or a traffic problem. The average B2B SaaS demo page converts at 1.5% to 4%, while the top quartile hits 8% to 15% (GrowthSpree, 2026).
- The most common silent killers are too many form fields, a buried call to action, slow pages, and a quiet shift in where your traffic comes from.
- A new factor now is AI search visibility. Buyers now ask tools like ChatGPT and Google’s AI Overviews for shortlists, and if you’re not cited, you lose demos before anyone reaches your site.
What A SaaS Demo Request Drop Actually Is
A demo request drop means fewer people are completing the action that turns a visitor into a sales conversation. That action is the handoff point between marketing and sales, so when it shrinks, everything downstream shrinks with it.
Here is the part most teams miss. A “30% drop” is a symptom, not a diagnosis. The number can fall for reasons that have nothing to do with each other. Maybe your paid traffic mix changed. Maybe a website redesign added friction to the form. Maybe a competitor started showing up in AI-generated answers where you used to be the obvious pick. Same outcome, very different fixes.
So before you change anything, you need to separate two questions. Are fewer people arriving? Or are the same people arriving and fewer of them converting? Those are different problems, and treating one like the other wastes weeks.
Why This Matters More Than The Number Suggests
Demo requests sit at the top of your revenue math. If you lose 30% of them and nothing else changes, you lose roughly 30% of the pipeline they would have produced, and then 30% of the closed revenue at the end of that pipeline. The damage compounds quietly over a quarter.
The funnel data makes this concrete. Across B2B companies, about 2.3% of website visitors become leads, 31% of those leads become marketing qualified, 13% of those become sales qualified, and 22% to 30% of opportunities become customers (First Page Sage and Ruler Analytics, 2025). Every demo you lose at the top gets multiplied down that chain. A small leak early becomes a real revenue gap later.
There’s also a timing trap. Most visitor-to-lead conversions happen within one to three days of the first visit (SaaS Hero, January 2026). If your follow-up or scheduling broke, you might be capturing the request but losing the person before they ever book. The form looks fine. The pipeline still bleeds.
How SaaS Demo Requests Leak: The Four Layers
Demo requests almost always drop at one of four layers. Walking them in order is the heart of the diagnosis.
Layer one is traffic. Not just the total, but the mix. Referral traffic converts highest in B2B at around 2.9%, organic search around 2.6% to 2.7%, paid search anywhere from 1.5% to 3.2%, and social media usually below 1% (First Page Sage, 2025). If your high-intent organic and referral traffic dipped and got replaced by social or broad paid clicks, your total visits can look stable while demos fall. The average hides the shift.
Layer two is the page. This is where small design choices do real damage. Single-goal landing pages with one focused call to action convert at about 13.5%, compared to 10.5% for pages with multiple competing calls to action (SaaS Hero, 2026). Removing the navigation menu from a demo page can lift conversion 15% to 25%, because the page has one job and the menu offers ten escape routes. And roughly 76% of high-converting demo pages show customer logos above the fold. If a redesign moved your proof below the fold or added new menu links, you may have built the leak yourself.
Layer three is the form. This one is brutal in its simplicity. Every form field above four reduces conversion by roughly 10% to 15% (GrowthSpree, 2026). If someone added a phone number field, a job title dropdown, and a “how did you hear about us” question in the name of better data, they may have quietly cut your demo requests by a third on their own.
Layer four is follow-up and scheduling. A request only matters if it becomes a meeting. Companies that let prospects book or talk to a rep instantly convert form fills to booked meetings at about 69%, slightly above the 67% average (Chili Piper, 2025). If your routing broke, your calendar link died, or response time slipped from minutes to hours, demos can look healthy in the form tool while meetings quietly disappear.
The Solution: A Four-Step Diagnostic Framework For SaaS
You don’t need a month-long audit. You need to isolate the layer that broke. Run these four steps in order and stop when you find the gap.
Step one: confirm it’s real, not seasonal.
Compare the same period year over year, not just month over month. B2B demand dips around holidays, end of quarter, and summer. Make sure you’re chasing a real decline and not a calendar pattern.
Step two: split traffic from conversion.
Pull two numbers. Unique visitors to your demo and pricing pages, and the demo conversion rate on those pages. If visitors dropped, your problem is upstream in marketing and search. If visitors held steady but the rate fell, your problem is on the page, the form, or the follow-up. This single split tells you which half of the playbook to open.
Step three: walk the four layers.
If it’s a traffic problem, check whether your channel mix shifted and whether you’ve lost visibility in organic search or AI-generated answers. If it’s a conversion problem, audit the page for added friction, count your form fields, and test your own demo request end to end like a real buyer would.
Step four: fix the highest-leverage layer first.
Don’t fix everything at once, or you’ll never know what worked. Start with the change that touches the most people. Page speed is often that lever, because it lifts every conversion on the site at the same time. Form length is usually the fastest single win.
As buyer behaviour moves toward ChatGPT, Google AI Overviews, and AI-powered search experiences, SaaS companies cannot solely rely on traditional SEO to generate demo requests.
Direct pipeline growth is now reliant on strong visibility across search engines and AI answers. That’s why investing in a scalable SaaS organic growth strategy helps brands consistently attract high-intent traffic, improve discoverability, and convert more qualified visitors into demo requests.
A SaaS Strategy Worth Stealing
Here’s the move most teams skip. Build a demo request “tripwire” so you never lose 30% silently again.
Pick three numbers and watch them weekly: visitors to your demo page, demo conversion rate, and demo-to-meeting rate. Set a simple alert if any one of them moves more than 15% in a week. Most demo drops are slow bleeds that nobody notices until the quarter closes. A weekly tripwire turns a three-month problem into a three-day one.
The second half of the strategy is about where buyers now start. In 2025 and 2026, a growing share of B2B research begins inside AI tools and Google’s AI Overviews, where buyers ask for shortlists before they ever click a website. If your brand isn’t being cited in those answers, you lose the demo before the visit. Recent analysis points to AI visibility and conversion maturity as the biggest drivers of the gap between average and top-performing teams (Predictable Profits and HubSpot State of Marketing, 2025). Showing up in AI answers is now part of demo generation, not a side project.
Common Mistakes That Make The Customer Drop Worse
The first mistake is shortening the form blindly. Fewer fields usually helps, but not always. Multi-step forms have outperformed single-step forms by a wide margin in some tests, because they feel lighter even when they ask for the same information. Test it, don’t assume it.
The second mistake is optimizing for demo volume instead of demo quality. A page converting at 8% with weak leads can produce fewer real opportunities than a page at 4% with strong ones. If you chase raw volume, you can “fix” the number and still starve sales.
The third mistake is comparing yourself to the wrong benchmark. HR tech converts at three to four times the rate of cybersecurity, but cybersecurity deals are far larger. A 2% conversion rate is underperforming in one vertical and excellent in another. Always judge against your own category.
How Bizllionaire Solves This Through Organic Growth Marketing
Most agencies will tell you to “optimize the landing page” and stop there. That’s treating a symptom. At Bizllionaire, we treat a demo drop as a full-funnel diagnosis, because that’s what the data demands.
We start by splitting your traffic problem from your conversion problem, so you stop guessing in week one. From there, we run the four-layer audit end to end. We check your channel mix and search visibility, we pressure-test your demo page against current conversion benchmarks, we count and cut form friction, and we trace every request through routing and scheduling to make sure it actually becomes a meeting.
Then we go where buyers now start. Our work spans SEO, answer engine optimization, and generative engine optimization, which is a careful way of saying we make sure you show up in Google, in AI Overviews, and in the AI tools your buyers use to build their shortlists. That combination is how you recover lost demos and keep them from leaking again, instead of patching one page and hoping.
If your demo requests have dropped and you want a clear diagnosis rather than a guess, that’s exactly the problem we’re built to fix.
Take The Next Step
If you’re staring at a 30% demo drop right now, don’t redesign anything yet. Request a detailed audit from Bizllionaire, and we’ll show you which of the four layers is leaking and what to fix first.
Frequently Asked Questions
What is a good demo request conversion rate for B2B SaaS?
The average B2B SaaS demo page converts at roughly 1.5% to 4%, while top performers reach 8% to 15% (GrowthSpree, 2026). Judge yourself against your own vertical, since HR tech converts far higher than cybersecurity, but lands smaller deals.
Why are my SaaS demo requests suddenly dropping?
Usually it’s one of four layers: a shift in your traffic mix, new friction on the demo page, extra form fields, or a broken follow-up and scheduling step. Sudden drops most often trace to a recent website or form change, or a loss of high-intent organic and referral traffic.
Is a demo request drop a traffic problem or a conversion problem?
Check two numbers. If unique visitors to your demo page fell, it’s a traffic and search problem. If visitors stayed steady but the conversion rate fell, it’s a page, form, or follow-up problem. This split should always come first.
How many fields should a SaaS demo form have?
Four or fewer for most teams. Every field above four cuts conversion by about 10% to 15% (GrowthSpree, 2026). Name, work email, company, and one qualifying question is a strong default. Drop the phone number unless your team calls within minutes.
How does AI search affect demo requests?
More B2B buyers now ask AI tools and Google’s AI Overviews for shortlists before visiting any website. If your brand isn’t cited in those answers, you lose demos before the click. AI visibility is now a core part of demand generation, not an extra.
How fast should I follow up on a demo request?
Not hours. Minutes. Most visitor-to-lead conversions happen between 1-3 days of the first visit with live-call or instant booking options converting form fills to meetings at approximately 69% vs. the average of 67% (Chili Piper, 2025).